

Abstract
Cattle farming is a major source of global food production and livelihoods that is being impacted by climate change. However, despite numerous studies reporting local-scale heat impacts, quantifying the global risk of heat stress to cattle from climate change remains challenging. We conducted a global synthesis of documented heat stress for cattle using 164 records to identify temperature-humidity conditions associated with decreased production and increased mortality, then projected how future greenhouse gas emissions and land-use decisions will limit or exacerbate heat stress, and mapped this globally. The median threshold for the onset of negative impacts on cattle was a temperature-humidity index of 68.8 (95% C.I.: 67.3–70.7). Currently, almost 80% of cattle globally are exposed to conditions exceeding this threshold for at least 30 days a year. For global warming above 4°C, heat stress of over 180 days per year emerges in temperate regions, and year-round heat stress expands across all tropical regions by 2100. Limiting global warming to 2°C, limits expansion of 180 days of heat stress to sub-tropical regions. In all scenarios, severity of heat stress increases most in tropical regions, reducing global milk yields. Future land-use decisions are an important driver of risk. Under a low environmental protection scenario (SSP3-RCP7.0), the greatest expansion of cattle farming is projected for tropical regions (especially Amazon, Congo Basin, and India), where heat stress is projected to increase the most. This would expose over 500 million more cattle in these regions to severe heat risk by 2090 compared to 2010. A less resource-intensive and higher environmental protection scenario (SSP1-RCP2.6) reduces heat risk for cattle by at least 50% in Asia, 63% in South America, and 84% in Africa. These results highlight how societal choices that expand cattle production in tropical forest regions are unsustainable, both worsening climate change and exposing hundreds of millions more cattle to large increases in severe, year-round heat stress.
Export citation and abstract BibTeX RIS

Original content from this work may be used under the terms of the Creative Commons Attribution 4.0 license. Any further distribution of this work must maintain attribution to the author(s) and the title of the work, journal citation and DOI.
1. Introduction
Livestock comprise by far the largest mammalian biomass on Earth [1, 2] and play a fundamental role in human wellbeing through direct contributions to food security and nutrition, as well as supporting crop production, supplementing income, providing employment, and fulfilling social or cultural needs [3–5]. However, heat stress is already a major problem for animal husbandry, costing as much as USD 1.7 billion annually in the USA alone, mostly in the dairy industry [6]. Originally domesticated in the highlands of Central Anatolia and Western Iran [7], cattle now make up the largest share of livestock globally [8] (figure S1). Investment in agriculture [9, 10], and livestock agriculture specifically [11, 12], has been touted by many as a solution for reducing extreme poverty and enhancing development. Given that beef and dairy products are often greenhouse gas intensive, many development pathways that involve growth in the livestock sector are expected to drive greater anthropogenic climate change [13–15], which, in turn, can increase the risk of weather conditions that exceed animal thermoregulatory capacities [16, 17].
When combined with elevated temperatures, high relative humidity (RH) limits a body's ability to dissipate excess heat by evaporation, particularly in species like cattle that sweat to maintain a stable internal body temperature (homeothermy) [18]. The temperature-humidity index (THI), which incorporates the effects of RH and environmental temperature, is the most extensively applied index used to determine heat stress in livestock [19–21]. Most studies on cattle use a specification from a landmark 1959 paper by Thom that was originally developed for humans [22], termed the human discomfort index, or close derivatives [21, 23–25]. Indices using wind speed and solar radiation have been developed to predict heat stress in livestock [26], such as 'adjusted THI' [27] and the comprehensive climate index [28]. Nevertheless, while wind speed and solar radiation (sometimes as the 'black bulb' temperature) undoubtably influence heat stress, THI has been found to be highly correlated with symptoms of heat stress in cattle [20, 24, 29, 30], as well as changes in production, mortality and fertility for cattle kept both indoors [31–42] and outdoors [34, 37, 42–46]. This, coupled with the fact that much of the literature reports heat stress using THI metrics that do not include solar radiation, and the fact that the effect of climate change on solar radiation is largely unknown, informed the choice of THI as the heat stress indicator for this study.
A number of challenges have hampered global assessment of heat-related risk to cattle. First, although an extensive body of literature on heat stress in livestock exists [47], most of these are case studies that use different specifications of heat stress. Second, while a small number of studies have projected future heat stress for specific regions [48–50], they often report these for different outcomes, making comparison across regions difficult. Third, while temperature increases are one driver of heat risk, changes in cattle exposure caused by future land-use decisions, such as the decision to expand and intensify cattle production, and resulting changes in livestock numbers may be of equal or even greater importance in determining overall heat risk to cattle, and thus need to be considered in heat risk projections.
The aim of this study was to quantify where and when damaging heat conditions occur, to forecast how different land-use and emissions pathways influence risk, and where adaptation will likely be needed. We conducted a global survey of peer-reviewed studies on heat stress in livestock to identify thresholds in climatic conditions associated with the onset of decreased production and fertility, and increased mortality, and quantify the impact of heat stress on milk yield. We used this information to quantify current and future occurrence of heat stress and heat-related impacts in cattle, and map this globally.
2. Data and methods
2.1. Literature search and evidence synthesis
On 27 February 2020, a search of the Web of Science Core Collection for terms relating to different livestock species and THI yielded 1138 results, of which 298 were included after systematic screening (see table S1 for details of the databases included, the search terms and inclusion/exclusion criteria); 29 additional studies were included from citation chaining. While the original intention was to examine heat stress in different livestock species, because most of the articles were on cattle (255 of 327), and these were also most comparable in their reporting, the scope of the study was reduced to focus only on this species. Of these 255 articles, 26 reported the results of 105 underlying studies (henceforth referred to as 'records') in sufficient detail for their data to be used in a meta-analysis determining the threshold for the onset of heat stress-related impacts, and 27 articles included 59 records that quantified the impact of heat stress on milk yield. Because there was some overlap between these two groups, in total 40 articles were included (figures S2, S3 and supplementary data). THI equations and their sources, breed, study location, management system, impact category (fertility, production or mortality), and the magnitude of impact (litres or kilograms of milk per cow per day per THI) were extracted.
2.2. Determining onset of heat stress
Because the underlying studies used different methods to identify THI thresholds, to identify and compare onset of heat stress in a standardized way, we used the WebPlotDigitizer [51–53] to obtain the individual data points from the 105 records that plotted changes in mortality, fertility or production against THI. We then tested for a threshold for onset of heat stress impacts using the same method for each record, using piecewise regression to select the number of breakpoints and the Bayesian Information Criterion in the 'segmented' [54] package in R. As a small number of studies also included thresholds for onset of cold stress, a model with two breakpoints was required to fit these data. Of the 105 records, 5 (5%) showed no relationship of outcomes with THI, and 10 (9.5%) showed no breakpoint, instead having strictly increasing impacts from the lowest reported THI. A sensitivity analysis checking whether including the ten monotonically increasing records altered the overall thresholds showed them to have little effect (see supplementary materials; confidence intervals are all bootstrapped); therefore, we only used the 90 records with an inflection point for our analysis. Of these 90 records, 85 used local weather station information and 5 used on-farm measurements. We discuss the limitations and strengths of these two sources of weather data in the supplementary materials.
2.3. THI conversions
For consistency, when comparing THI thresholds across studies, we converted all THI specifications to Kelly 1971 specification [25] (equation (1)) as follows: using the THI equation from each study and fixing RH at 50%, we calculated the temperature from the THI threshold identified during our breakpoint analysis. This calculated temperature and 50% RH were then inputted into the Kelly [25] equation to get the normalized THI threshold. We used this conversion method because the alternative THI equations in our sample (e.g. [55]) are comparatively flat in humidity space (that is, humidity is weighted less than in Kelly [25]). Converting at 50% RH minimizes conversion bias.
equation (1) [25] (T in degrees Fahrenheit, RH in percent)
We used daily mean THI in our calculations, which has been shown to be a good indicator of heat stress, and was most commonly reported in the included studies [34, 42] (see supplementary materials). While daily maximum THI predicts the most severe heat stress at that moment, daily mean THI indirectly incorporates night-time cooling, or whether the cattle experience relief from heat stress at night [44]. For those studies that used daily maximum THI, these were corrected to daily mean THI using the baseline climate (1985–2014) for their georeferenced location from HadISD v3.1.0.2019f (HadISD is 'a sub-daily, station-based, quality-controlled dataset designed to study past extremes of temperature, pressure and humidity and allow comparisons to future projections' [56], see supplementary materials).
2.4. Relationship between current climate and heat stress threshold
To test whether the onset of heat stress increases from cool to hot locations, a potential indicator of adaptation or tolerance, we compared thresholds against their current (1985–2014) climatological mean annual daily THI obtained from ERA-5 (ERA-5 is the fifth generation European Centre for Medium-Range Weather Forecasts reanalysis of global climate and weather, and provides hourly estimates of atmospheric, land and oceanic climate variables covering the Earth on a 30 km grid) [57]. For records where cattle are distributed across large regions (e.g. New Zealand or the state of Florida), we used the spatially weighted mean of the annual daily THI based on the observed cattle distribution in the region [58]. Regression models included THI thresholds as the response variable and THI of the current climate as the predictor variable, with the country of the study and impact type (production, fertility and mortality) as fixed effects. Despite finding a positive and weakly statistically significant relationship between THI thresholds and mean THI of the current climate at a site (p = 0.1; table S6 and figure S16), which provides some evidence of adaptation in hotter climates, and matches findings for other agricultural systems [59], particularly crops [60, 61], for this analysis, we elected not to account for spatially explicit thresholds when determining the future risk of heat stress and for quantifying impacts of exposure to heat. This was because: (i) the apparent effect of current climate on heat stress threshold may overestimate adaptation in hotter regions due to the limited number of studies, (ii) for projected future risk, there is no evidence of the time scale over which this adaptation may take place, and (iii) confounding with differences in breeds/types/management systems. This is a limitation that future work should attempt to address.
We also compared the THI thresholds for cattle kept indoors with those kept outside and found there was no statistically significant difference (indoor median = 69.0 (s.d. 7.7), outdoor median = 67.2 (s.d. 8.8), Moods median test = 1.65, p = 0.19).
2.5. Quantifying current heat stress globally
Gridded reanalysis hourly temperature and dewpoint temperature were taken from ERA-5 [57]. Daily THI mean and maximum values were calculated for each 0.25° grid cell using equation (1). RH was calculated using the equation from Stull [62] and Bolton [63]. Heat stress duration was calculated as the mean number of days in a year above the THI threshold (THI = 68.8). Severity of heat stress was calculated as the mean amount by which daily THI exceeded the THI threshold for all days above the THI threshold in a year. A description of the results of a sensitivity analysis testing our heat stress projections for cattle with high heat tolerance is presented in the supplementary materials.
2.6. Future climate projections
Climate model historical simulations (1985–2014) and future projections under the Shared Socioeconomic Pathways (SSPs, representing five scenarios where global society, demographics and economics change to different extents over the next century) were taken from the coupled model intercomparison project phase 6 (CMIP-6) archive [64, 65]. CMIP-6 consists of a large set of general circulation models (dynamically coupled to ocean and land models) which simulate climate under harmonized conventions including model initialization, setup and forcings over a wide variety of control simulations and future economic pathways. Future climate projections rely on illustrative scenarios that combine each SSP with one of four possible future greenhouse gas concentration trajectories known as representative concentration pathways (RCPs).
Daily mean near surface temperatures (tas) and specific humidity (huss) were used to calculate daily mean THI using equation (1).
Future heat risk was calculated for each 0.25° grid cell as the number of THI units over threshold for each day, summed across all days in a decade (sum of max(0, THI − THI threshold) for all days in a decade), and multiplied by the number of cattle in the grid cell in that decade, which returns units of cattle-THI. Percentage increases in risk were calculated as the percentage increase in heat risk in 2095–2100 compared to 1985–2014 in cattle-THI.
For details of the climate models used, the steps taken to calculate climate and heat stress projections for end of century for each SSP-RCP scenario, country-level aggregation, and geographic cattle density weightings, please refer to the supplementary materials.
2.7. Future cattle increases under different SSPs
Here we focused only on SSP1-RCP2.6 ('Sustainability' scenario) [66] and SSP3-RCP7.0 ('Regional Rivalry' scenario) [67]. We selected these two scenarios as they represent among largest projected divergence in future livestock consumption globally, and also in the expected challenges to climate change mitigation and adaptation. For each SSP, we used the so-called marker model scenario for land use change projections (LUH2 [68], see Popp et al [69] and Stehfest et al [70] for details about model assumptions; 'reforming economies' are not included).
Projected expansion or contraction of future cattle numbers was calculated at the regional level, based on 2015 numbers [8] and applying the projected percent change in production from the integrated assessment models (IAMs) used for SSP analyses for each decade until 2090 [71]. Cattle were added or removed from individual countries based on those countries' share of change in agricultural land (cropland + pasture + rangeland) from the same baseline IAM. We did not account for density variation within a country, or move existing cattle within a country. For further detail please see the supplementary materials.
2.8. Milk production impacts
The linearized reduction in milk yield per cow per day per unit THI over threshold was extracted from studies reporting changes in milk yield in kg or l per unit THI per day, yielding 59 published slope coefficients. Because there is evidence of differing heat tolerance between Bos taurus (taurine) and Bos indicus (indicine) cattle, both anecdotal and shown experimentally [72], to account for the possible effect of type on changes in milk yield, we used genotype data to determine the dominant type of dairy cow in each country [73] (figure S9).
The mean daily increase in THI units over the overall median threshold was calculated for SSP5-RCP8.5 and SSP1-RCP2.6 in 2045–2055, with the number and location of cattle in each country held fixed at 2010 levels. Dairy cows are assumed to be evenly spatially distributed across all cattle occurrences within a country (no dairy-only dataset is available). A sensitivity test was also applied where dairy cows were assumed to be evenly distributed across the coldest third of grid cells with cattle in each country (figure S15). To determine the reduction in milk yield in litres per cow per day, the mean daily increase in THI units over threshold at the country level was multiplied by the slope coefficients from the literature for either taurine or indicine cattle, depending on the dominant type in each country. The percent reduction in milk yield at a country-level was then calculated from the baseline daily milk yield production data from the Food and Agriculture Organization of the United Nations (FAO) statistical database (FAOSTAT) [8]. Absolute regional production values were aggregated based on country-level total milk production and the country-level percent reduction.
We separated uncertainty in projected impacts due to: (i) uncertainty in published statistical estimates of the effect of heat stress on milk yield, and, (ii) uncertainty in climate projections. To quantify (i) we used the median climate model projection for a given SSP-RCP scenario, and projected milk yield losses for the bootstrapped 95% confidence interval around the median published slope estimate. To quantify (ii) we used the median slope coefficient and reported the range of impacts for each region across the 11 global climate models.
3. Results
3.1. Heat stress thresholds for mortality, fertility and production
Peer-reviewed studies quantifying heat stress impacts on cattle fertility, production and mortality are mostly concentrated in temperate climates with high cattle density, particularly Europe and North America, with cattle in India, South America and Africa relatively understudied (figure 1(a)). Nevertheless, the studies in our sample cover a wide range of climate conditions (figure 1(b)), spanning 20 years (1999–2020) and 22 countries.

Figure 1. Cattle heat stress studies globally and temperature-humidity thresholds for onset of production, fertility and mortality impacts. (a) Distribution of study locations globally overlain on FAO data for 2010 cattle density in grey [58]. (b) Distribution of heat stress studies (pink) across the temperature-humidity space for current cattle distribution globally (darker shading shows higher cattle density), showing the coverage of different baseline climates in our sample. (c) Temperature-humidity index (THI) threshold (median = 68.8, 95% confidence interval 67.3, 70.7) calculated from 95 records from studies documenting onset of heat stress impacts on cattle production, fertility or mortality. Eighty-three per cent of records indicated thresholds for onset of heat stress in cattle at temperature-humidity conditions below widely-cited onset values used in heat stress projections and to guide cattle farmers, such as Livestock Weather Safety Index (LWSI) [74]. Curves represent constant THI across relative humidity and temperature, according to Kelly 1971 [25] (see equation (1) in section 2). Dashed line shows median THI threshold and dark grey shading shows 95% confidence interval (bootstrapped, typ.). (d) Distribution of THI thresholds from individual records for production, fertility and mortality.
Download figure:
Standard image High-resolution imageCombining all studies globally, we find a median threshold for onset of negative impacts at THI of 68.8 (95% C.I. 67.3, 70.7; figure 1(c)). We did not find any statistically significant difference between median THI thresholds for mortality (65.8; 95% C.I. 63.4, 68.1), fertility (68.4; 95% C.I. 61.8, 75.0), and production (mostly milk yield, 70.5; 95% C.I. 68.1, 72.9) (Mood's median test = 3.3, p = 0.20; figure 1(d)). We find that 83% of the THI threshold values from published studies are associated with the onset of negative impacts on cattle at lower temperature-humidity conditions than the frequently cited thresholds used in warning systems for cattle, such as the Livestock Weather Safety Index [74] (figure 1(c)).
3.2. Quantifying current and future heat stress globally
Combining the median heat stress threshold (THI > 68.8) and the current global distribution of cattle, we estimate that 77% of cows are already exposed to climate conditions likely to cause heat stress for at least 30 days each year, with 20% of cattle (those in the tropics) exposed to heat stress conditions year-round (figure 2(a)). Holding global cattle distribution constant, by 2100, under a high emissions scenario (SSP5-RCP8.5, that is >4°C global warming above 1850-1900 levels for the set of climate models used in this study), these percentages are projected to increase to 90% of cows exposed for at least 30 days each year, and 34% experiencing year-round heat stress.
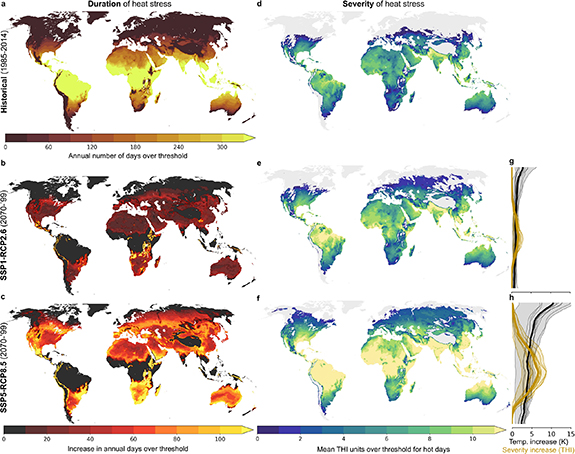
Figure 2. Climate hazards for cattle under current and future climates. (a) Mean number of days per year under historical climate (1985–2014) that were above the threshold for heat stress impacts on production (THI > 68.8). (b), (c) Mean projected increase in number of days per year above THI threshold of 68.8 under low (SSP1-RCP2.6) and high (SSP5-RCP8.5) greenhouse gas emissions scenarios. (d)–(f) Severity of heat stress: mean amount by which the THI threshold is exceeded on hot days (defined as days with THI > 68.8). (g), (h) Latitudinal mean of the increase in daily temperatures over land (black) and of increase in mean units of THI exceeding the threshold for hot days (gold), compared to historical climate. Maps use historical climate data from ERA-5 and climate projections from 11 CMIP-6 models. Note: light grey areas panels (d)–(f) have no days above threshold, and black areas in panels (b), (c) already experience year-round heat stress or no days above threshold.
Download figure:
Standard image High-resolution imageThe projected increase in heat stress duration is greatest in sub-tropical and temperate regions (figures 2(b) and (c)). By 2100, under a high emissions scenario, year-round heat stress expands into southern Brazil, southern Africa, northern India, northern Australia, and central America (figure 2(c)). Multiple months of heat stress are projected across Europe and the United States, with the emergence of over 180 days of heat stress across China and southern Japan, Mexico and the southern United States, southern Europe, and southern Australia (figures 2(c), S6). Under a low emissions scenario (SSP1-RCP2.6, that is ∼2°C global warming above 1850-1900 levels for the set of climate models used in this study), the expansion of 180 days of heat stress is limited to sub-tropical regions (figure 2(b)). Uncertainty in projections due to differences across multiple climate models indicates a large range in the potential spatial extent of regions exposed to two-month heat stress across Eurasia and North America under a high emissions scenario (figure S5).
The severity of heat stress is also projected to increase with climate change. Heat stress severity is currently greatest in the tropics, as well as northern India and Pakistan (figure 2(d)). Tropical regions that already endure year-round heat stress for cattle are projected to experience substantially more severe heat stress under climate change (figures 2(e) and (f)). Although absolute temperature increases are projected to be greater toward the poles, increases in the severity of heat stress for cattle are projected to be greatest in the tropics where THI conditions already exceed the heat stress threshold (figures 2(g) and (h)).
Reductions in greenhouse gas emissions will reduce the projected severity and duration of heat stress in the future. Holding current cattle densities and spatial distributions constant, for a high emissions scenario (SSP5-RCP8.5) in 2070–2100, the median cow is projected to experience an additional two months (63 days) of heat stress at a mean severity of 9.3 (±3.9 s.d.) units over the heat stress threshold. In contrast, a low emissions pathway (SSP1-RCP2.6) is projected to reduce this exposure to an increase of only 24 days with a mean severity of 6.8 (±3.1 s.d.). Excluding regions already enduring year-round heat stress, a low emissions scenario avoids on average 48 days (mean ± 34 s.d.) of exposure for the median cow.
3.3. Future pathways of heat risk to cattle
Multiple regions have both high severity of heat stress under current climate, as well as high cattle densities, including: India, Brazil, the Sahel, southern United States, and China (figure 3(a)). However, although increases in temperature in these regions increase risk of heat-related impacts, changes in cattle exposure to heat due to future land-use decisions and associated changes in livestock numbers are also potentially important drivers of risk. For instance, in some regions, under a future scenario of 'Regional Rivalry' (SSP3-RCP7.0), with high population growth in developing regions, high greenhouse gas emissions, and uneven cooperation for addressing environmental concerns [71, 75], livestock production is projected to increase substantially. Assuming cattle remain a large proportion of all livestock, we project cattle numbers will nearly double in Asia, more than double in Latin America, and increase over four-fold in Africa for SSP3-RCP7.0 (figures S11 and S12).
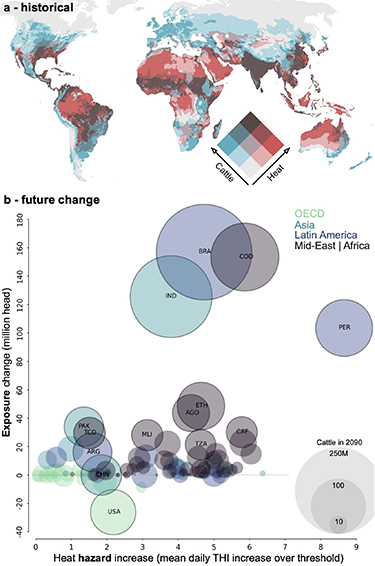
Figure 3. Cattle husbandry is projected to expand most in heat-stressed countries. (a) Historical heat exposure for cattle showing where historical yearly heat stress severity intersects with historical cattle densities from FAO [58]. (b) Projected country-level change in cattle numbers and heat hazard (that is severity of heat stress) in cattle farming regions for a high-emissions, low environmental protection 'Regional Rivalry' scenario (SSP3-RCP7.0) in 2085–2095 compared to a 1985–2014 baseline. Bubble size is the projected number of cattle in each country in 2090. Countries with more than 30 million cattle in 2090 are labelled with their ISO codes. See figure S13 for projected exposure and heat hazard changes from 2030 through to 2090, and figure S14 for a comparison between 3b and the same data under SSP1-RCP2.6.
Download figure:
Standard image High-resolution imageYet, under this scenario of high emissions and low environmental protection, this expansion in cattle production is projected to occur in many of the same regions and countries where heat stress is also projected to increase the most, thereby exacerbating risk (figure 3(b)). If increases in cattle production follow patterns of overall agricultural expansion, our projections indicate that development pathways that increase cattle numbers in India and expand cattle production into the Congo Basin and the Peruvian and Brazilian Amazon will expose over 537 million more cattle to heat stress conditions by 2090 compared to 2010 cattle numbers (figure 3(b)), with regions of Peru at high risk as early as 2030 (figure S13). Globally, under the SSP3-RCP7.0 scenario, the number of cattle exposed to a 1 unit THI increase over threshold is projected to increase by 1.078 billion compared to 2010 cattle numbers (figure 3(b)).
This combination of rising temperatures and projected changes in the number and location of cattle drives risk across both developed and developing country regions. Under the 'Regional Rivalry' scenario, the highest increase in risk is projected for Africa and Latin America, followed by Asia and the Organisation for Economic Cooperation and Development (OECD) countries (figures 4(a)–(d)). By 2090–2100, these increases correspond to a 200% increase of heat risk to cattle in Asia and the OECD, a 300% in Latin America, and a 1000% increase in Africa compared to current conditions. However, the relative contribution to heat risk that is from warming versus changes in the number and location of cattle differ strongly among these regions. In Asia and Latin America, the projected increase in risk is due almost equally to the increasing heat hazard from warming and increased exposure from increasing cattle numbers in hot regions. In contrast, in Africa, the overwhelming majority of the projected risk increase is driven by increasing cattle numbers and projected expansion of cattle farming into more heat-stressed regions (figures 4(e)–(h)).
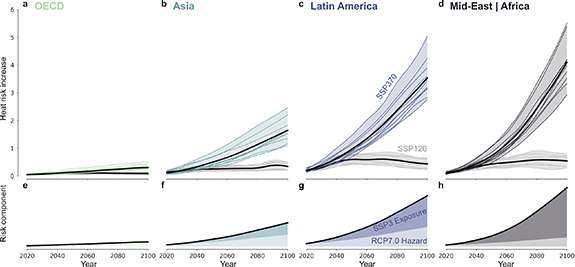
Figure 4. Projected increases in heat risk to cattle in the 21st century. (a)–(d) Heat risk increase for cattle for a high emissions, low environmental protection scenario with large increases in cattle production (SSP3-RCP7.0; colours) versus a low emissions, high environmental protection scenario with low increases in cattle production (SSP1-RCP2.6; grey). Heat risk increase on the y-axis is the projected number of cattle multiplied by the increase in total THI units over the heat stress threshold in each decade in cattle locations (units are increase in billion-cattle-THI, e.g. 200 million cows multiplied by an increase of five THI units over threshold is 1 billion). Lines are individual climate models and thick black lines are ensemble means. (e)–(h) Relative proportion of risk increase due to climate change (the hazard) versus changes in cattle production (the exposure) for SSP3-RCP7.0. Light shading indicates proportion of risk increase due to climate hazards and coloured shading is risk increase due to changes in cattle number and spatial distribution.
Download figure:
Standard image High-resolution imageCompared to a high emissions, low environmental protection scenario (SSP3-RCP7.0), a low emissions and higher environmental protection scenario (SSP1-RCP2.6) is projected to reduce heat risk for cattle by at least 50% in Asia, 63% in South America, and 84% in Africa (figure 4).
3.4. Projected impacts of heat stress on milk yield
Global milk production is projected to be adversely affected by increased heat stress (figure 5). Compared with 2015 levels and holding cattle numbers fixed, global milk yields are projected to decline by around 11 million tonnes under a high emissions scenario by 2050, but are reduced by only around 6.5 million tonnes under a low emissions scenario (figure 5(b)). Fractional losses (>50%) are projected to be highest in Africa (due to low current milk yields), while absolute losses of milk yield are largest in Africa and Asia (figures 5(a) and (b)). However, climate uncertainty in these projections is high, with projected losses in Africa, Latin America and Asia potentially ten times greater than the median response (figure 5(b); table S7).

Figure 5. Projected heat stress impact on milk production by 2050 without adaptation. (a) Percentage change in milk yield in 2050 under a high greenhouse gas emissions scenario (SSP5-RCP8.5) relative to 2015 country-level milk yield from FAOSTAT [8]. Map percentages calculated for the ensemble median from CMIP-6 and the median regression slope from 27 published studies of heat stress impacts on milk yield. (b) Absolute change in milk production in 2050 compared with 2015 production levels. Thick black lines show mean production loss projected under a high emissions (SSP5-RCP8.5, coloured bars) and a low emissions (SSP1-RCP2.6, pale grey bars) scenario. Solid vertical lines show the uncertainty range for projected losses due to uncertainty in the relationship between heat stress and milk yields (95% confidence interval on the median published estimate) and dashed vertical lines show uncertainty in climate projections (impact range for 11 global climate models on the median regression coefficient). See table S7 for a regional breakdown of baseline (2015) milk production with projected change in production by 2050 under SSP5-RCP8.5.
Download figure:
Standard image High-resolution image
A sensitivity test for climate impacts on milk production considered that dairy farming is sometimes more concentrated in cooler regions of a country. Placing dairy cows in the coldest third of each country's climate resulted in OECD countries seeing the greatest reduction in projected impacts, with projected losses in milk production due to future increases in heat stress decreased by almost two-thirds (although these countries were already projected to be least impacted). Projected impacts were decreased by a third in Latin America, but Asia, the Middle East and Africa showed smaller benefits for decreasing impacts (figure S15; table S7).
4. Discussion
Livestock exposure to excessive heat results in impacts that range from impaired (re)production—including fertility, milk yield, and growth rate—to increased susceptibility to disease and death [76].
Our study underscores the current and increasing threat to cattle posed by climate conditions associated with heat stress. Our synthesis of THI thresholds indicates that temperature and humidity conditions associated with the onset of fertility, production and mortality impacts frequently occur below widely used thresholds for thermal safety in cattle, and that currently 77% of cattle may be exposed to climate conditions associated with heat stress for at least 30 days each year. The area exposed to year-round or six-month heat stress conditions is projected to increase under all emissions scenarios, with the severity of heat stress increasing most in the tropics (figure 2). However, the proportion of cattle exposed to future heat stress is strongly dependent on future land-use decisions and development pathways. In particular, societal choices that expand livestock production in tropical forest regions are unsustainable, both worsening climate change [15, 77] and exposing these cattle to large increases in severe, year-round heat stress. In contrast, a steep reduction in greenhouse gas emissions to a low emissions pathway with no or lower increases in livestock production (SSP1-RCP2.6) is projected to reduce these risks by at least 50% in Asia, 63% in South America, and 84% in Africa (figure 4).
Adaptation of livestock farming systems to reduce the impacts of heat stress will also be essential, even if greenhouse gas mitigation targets that limit future global warming are achieved. Adaptation options may include a combination of: (i) proactive environmental modifications to reduce heat load and improve heat loss, such as provision of shade, improved ventilation and the use of fogging devices and fans; (ii) strategies to minimize metabolic heat production such as changes in time of feeding and type of feed [78]; (iii) genetic selection for heat tolerance [43, 78]; (iv) seasonal management of calving [49]; and (v) the selection of more heat-adapted cattle breeds (e.g. switching from taurine to indicine cattle) or other livestock species such as goats [79, 80]. However, the selection of heat-tolerant breeds or species come with trade-offs for production; for example, selection for higher milk yield has been found to reduce heat tolerance [81]. We also note the feasibility of a given adaptation option will vary with local context. Additional climate impacts not considered in our study may also affect future changes in cattle numbers and land-use decisions, including negative impacts of future warming on cattle fertility potentially reducing cattle numbers, decreased herbaceous cover in rangelands reducing forage (with parts of Australia, Asia and sub-Saharan Africa most at risk), and farmers adjusting stocking in response to changes in drought [82, 83].
We note several limitations with employing THI for global heat stress projections for cattle. First, evaporative cooling is critical for cattle under heat stress conditions. While RH approximates the amount of additional water the air can hold, vapour pressure deficit is the more accurate measure [84]. The use of RH in all THI formulations therefore only approximates the ability of cattle to cool themselves. Additionally, the impacts of solar radiation and wind speed, while important components of heat stress in some areas [27], were not included in our analysis. This may influence heat stress estimates, particularly for cattle kept outdoors.
Nevertheless, we caution that our projections of heat risk (figure 4) may underestimate risk because they treat risk as increasing linearly above a heat stress threshold and do not incorporate potentially nonlinear increases in impacts, such as have been reported for mortality [85]. Also, because we specifically focused on heat stress, some studies reporting hump-shaped response curves of milk yield to temperature may have been missed. Therefore, our projections of milk yield changes do not account for mitigation of cold stress that may occur due to warming in colder regions like New Zealand [86]. However, this benefit is likely to be marginal, since cattle are primarily housed indoors during the winter months in temperature regions, and since adult cattle are often well adapted to low temperatures [87]. We also do not consider potentially compounding effects of multiple days of exposure, such as during heat waves [47]. Lastly, we project multiple months of heat stress in many tropical regions, but reports of widespread heat-related impacts in these regions are largely absent from the literature. This may indicate that estimated THI thresholds are too low for these regions and that a higher heat stress threshold is more appropriate in hot climates (figure S6). However, it may also indicate bias towards North America and Europe in the literature and substantial underreporting in lower-income countries. This is known to be the case for human mortality and morbidity from heat (where reporting might be expected to be strongest). For example, sub-Saharan Africa has experienced multiple heatwaves since 1900, but extreme weather damage databases report no significant impacts [88].
Future work is needed to integrate these effects when mapping heat risk, and to fill reporting gaps in the literature for heat stress thresholds more specific to cattle breed, housing and management.
There is a clear expansion of heat stress conditions globally under both low and high emissions scenarios and a need for future work that quantifies the efficacy of different adaptation options under future climate scenarios [49, 89], especially in understudied tropical regions. The quantification of economic losses could help justify mitigation and adaptation actions and inform investments to deal with sustained risks of heat stress. Our results emphasize that in the absence of transitions to more sustainable food production and consumption pathways, increasing demands for livestock protein combined with climate change will undermine the productivity and welfare of hundreds of millions of cattle exposed to severe heat stress.
Acknowledgments
M A N was supported by DAAD within the framework of the climapAfrica programme with funds of the Federal Ministry of Education and Research. J A F was supported by the NSF NRT program (Grant No. DGE-1735359) and the NSF Graduate Research Fellowship Program (Grant No. DGE-1746045). C H T and B O were supported by the UK Government's Foreign, Commonwealth and Development Office and the International Development Research Centre, Ottawa, Canada (Grant No. 109419–001) and the FLAIR Fellowship Programme: a partnership between the African Academy of Sciences and the Royal Society funded by the UK Government's Global Challenges Research Fund.
Data availability statement
All data that support the findings of this study are included within the article (and any supplementary files).
Code availability
All code used in this analysis is available here: https://github.com/jamesafranke/cattle_heat_stress.
Author contributions
C H T, M A N, and J A F conceived the research. M A N and B O performed the literature review. J A F conducted all statistical analyses and prepared the figures. All authors contributed to interpreting the results of the analyses and the writing of the manuscript.
Conflict of interest
The authors declare no competing interests.
Literature review data (0.2 MB XLSX) Data derived from the literature review
Supplementary data (13. MB DOCX) Additional methods detail, supporting tables and figures